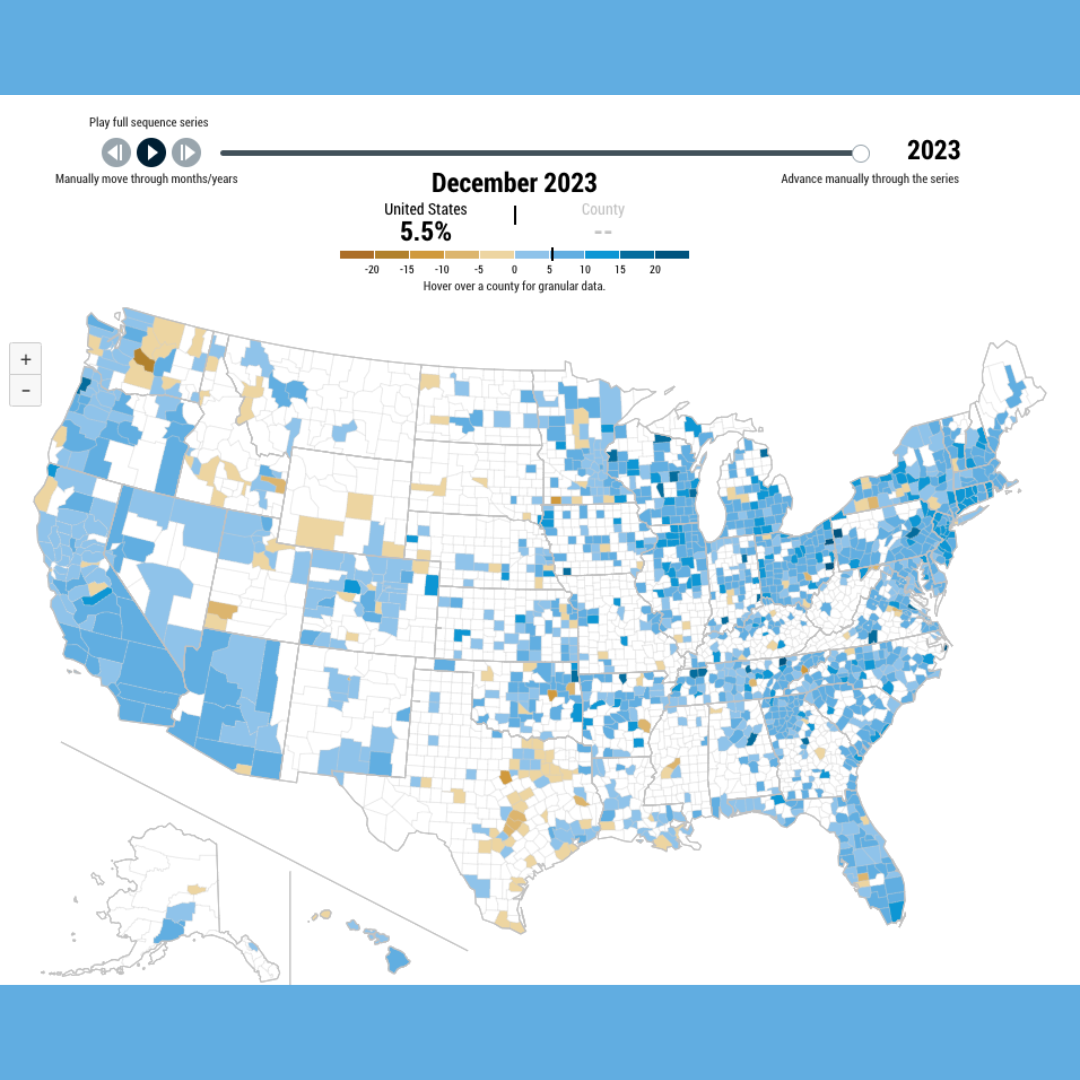
This fascinating interactive map showcases the year-over-year changes in home prices across the United States from 2003 to 2024. This dynamic tool, updated monthly with new home price index data, provides a comprehensive visual representation of how housing prices in different counties have increased, decreased, or remained stable. By hovering over individual counties, users can access granular data, offering insights into regional and national trends. Uncover the evolving landscape of U.S. real estate by exploring this informative and engaging feature, perfect for homebuyers, investors, and real estate enthusiasts. Be sure to click on “National Prices” to see Florida’s data. Click Here to check it out now.
Over 5 years, I’ve been a multi-million-dollar top producer with topnotch marketing, sales, and—above all else—a vast network and resources to achieve your real estate goals. I am a second generation Sarasotan and I love this city! I have since learned the intricacies of each neighborhood, each having its own unique and interesting history. Real estate is my true passion and I have built lasting relationships with many happy and satisfied clients. Let me be your local expert and help guide you through the market and process I know best. Let’s get on a call if you or someone you know is interested, my direct line is 941-284-0283.